 Omoikane Labs
When a Linux sample produces no traffic, I first want to know why. The binary may target a different CPU. It may be waiting for a DNS or IRC reply that the lab cannot provide. It may also reach a local check and exit before its network code runs. From outside the sandbox, all three cases look like a quiet sample.
I handle them in that order. I start with explicit QEMU user mode, add default FakeNet, teach the local service only the protocol the sample has already asked for, and use eBPF only after the trace points to one specific decision. Every extra change makes it harder to tell which behavior came from the sample and which came from the lab.
The four hashes in this post each stopped for a different reason. The
RondoDox-labeled sample made an HTTP request as soon as default FakeNet accepted
its traffic. The ARM Tsunami-labeled sample registered over IRC under QEMU, but
needed a valid IRC reply before it sent JOIN. The provisional Aisuru sample
used DNS over TCP, which the original listener parsed incorrectly. The
RustDuck-reported loader reached a denied PTRACE_TRACEME path and stopped
before sending any application data.
That last case is where eBPF changed the result. The ptrace call stayed denied,
the child still exited with code one, and the kernel wait status remained 256.
I changed only the four-byte status word read by the parent. The sample then
connected to 176.65.139[.]11:1337, sent a 32-byte frame and reached a receive
wait that never appeared in the baseline.
These are the four files used in the runs:
| Label used here | Architecture | Exact SHA-256 | Attribution boundary |
|---|---|---|---|
| RondoDox-labeled sample | x86-64 | f19b0fd9c9f768b0859754a8ff5edfbb6f73793f0006309d4be6feb55bd6a2fd |
MalwareBazaar records a Mirai signature and RondoDox tags. |
| Provisional Aisuru candidate | MIPS32 big-endian | 9d12a0b1dac5467771edfeccb3c599b73412c0754051f5b0aabc8013e9346d50 |
MalwareBazaar records a Mirai signature and an aisuru tag; exact family attribution remains provisional here. |
| Tsunami-labeled IRC sample | ARM32 little-endian | aebc7d622eaef343c462ac1f4442191798c3f59563f222fa8cf386d15fe44225 |
URLhaus records the same payload hash with a Tsunami tag. |
| RustDuck-reported loader variant 3 | i386 | b519ae088ee0fd4658c16aab474d51c6acdc5c9cd7fab3fd69032d05a45ffd9b |
XLab lists its SHA-1 as RustDuck loader variant 3. MalwareBazaar maps that SHA-1 to this SHA-256 while labeling the record Gafgyt. |
The names in the table come from public reporting and repository metadata. The runtime claims come from these exact hashes. I keep that distinction explicit because the MIPS attribution is provisional and MalwareBazaar labels the RustDuck-reported hash as Gafgyt.
One quiet run can have several causes
FortiGuard reports RondoDox on several Linux architectures, so the first task was simply to run the right CPU architecture. XLab’s Aisuru research describes DNS-based controller discovery and encrypted communication, which made the DNS transport part of the analysis. Its RustDuck report covers a two-stage loader family with changing packers and configurations; in this i386 run, a local ptrace check guarded the first network stage. The ARM sample ran under QEMU but stayed at IRC registration until the server spoke IRC back to it.
I used one rule throughout the work: make the smallest change that can answer the next question, record exactly what the lab supplied, then stop when the remaining behavior depends on an unknown peer. A short trace with a clear cause is more useful than a long trace built on a fabricated socket state or a guessed controller command.
I organized the runs into four levels and moved on only when the current level left a specific question unanswered. eBPF came last, after the earlier levels had ruled out architecture and network-service problems.
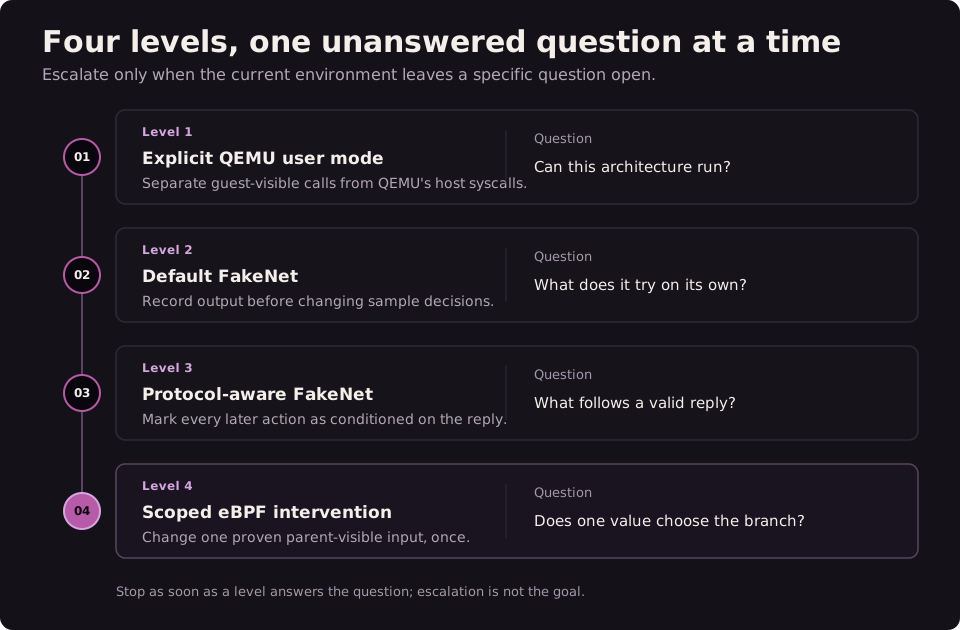
Figure 1. Each level changes one part of the environment. I move to the next one only when a specific question remains unanswered.
The lab: two containers and one observer
I kept the sample and FakeNet in separate containers, with only a private network namespace shared between them. Their process, mount, filesystem, IPC, UTS and cgroup namespaces stayed separate. The sample ran as an unprivileged user with a read-only root, zero capabilities, a PID limit and a fixed runtime. ARM and MIPS samples ran through a named QEMU user-mode binary inside the execution container.
The eBPF program ran on the host and filtered events by the execution container’s cgroup. FakeNet activity and unrelated host processes therefore stayed out of the sample trace. Before releasing the payload, a start gate waited for both containers, the local services, the cgroup filter and the observer.
The provider firewall stayed at outbound DROP with zero allow rules. FakeNet
diverted DNS and application traffic inside the private namespace, while PCAPs
kept the original destination address. None of the resolvers, domains or
candidate controllers in this post received live traffic.
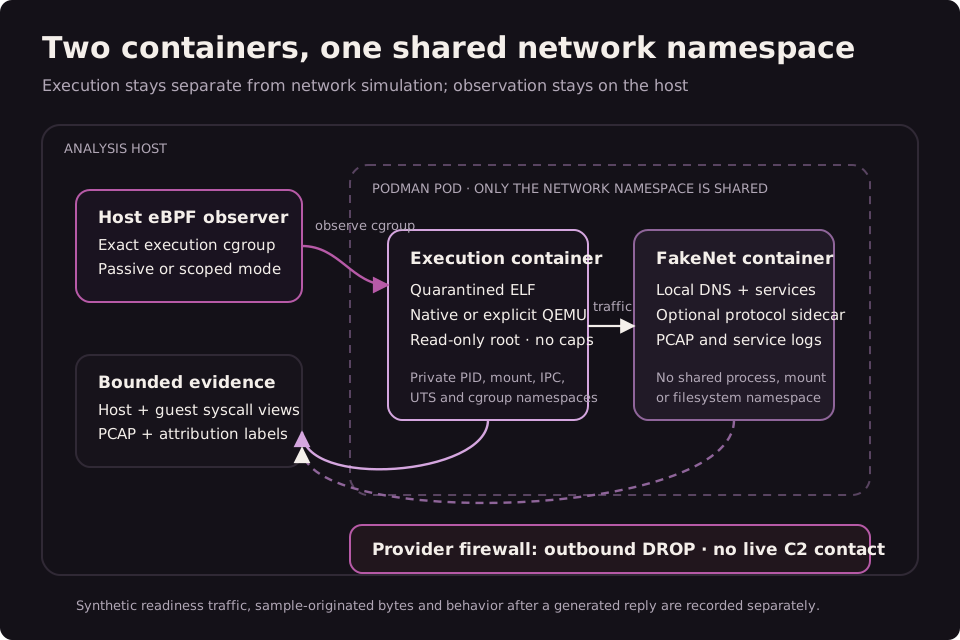
Figure 2. FakeNet and the sample meet only in the private network namespace. Host eBPF observes the execution cgroup from outside both containers.
Before each run, the lab sends health checks to confirm that the local services are ready. I record that traffic separately from bytes sent by the sample. I also keep lab-generated replies separate from any sample bytes sent afterward. This lets me tell whether a packet came from the sample or the lab, and whether the sample sent it before or after receiving a reply.
Level 1: run the target architecture
For ARM and MIPS, the first question was whether the CPU mismatch explained the
silence. I disabled automatic QEMU binfmt_misc handlers and selected the
emulator explicitly. The MIPS binary could run only through
qemu-mips-static; the ARM binary could run only through qemu-arm-static.
The run record therefore names the emulator that executed each sample.
QEMU user mode also gives two different traces. Its syscall diagnostics show the guest calls and results visible to the sample. Host eBPF sees the syscalls that QEMU makes against the Linux kernel. I use the first to understand the sample’s view and the second to confirm what the emulator did on the host. Original packets remain the evidence for network behavior.
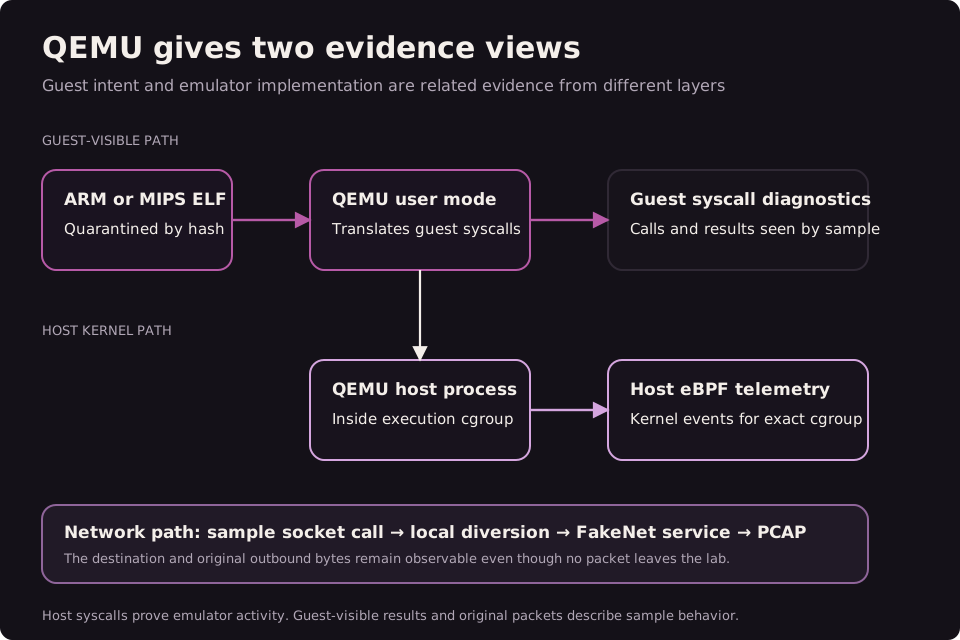
Figure 3. QEMU translates the guest ABI inside the execution container. Guest diagnostics, host cgroup telemetry and network evidence remain distinct.
The ARM hash aebc7d62…44225 produced useful traffic at this first level. Under
passive observation it emitted IRC NICK and USER commands and attempted
several TCP/8080 endpoints, including
46.149.233[.]35, 129.213.23[.]99, 106.14.242[.]136 and
95.142.44[.]96. QEMU was enough to expose its IRC registration. I made no
eBPF change.
Level 2: let default FakeNet answer
I run default FakeNet before writing any sample-specific response. It answers common DNS and service requests locally, accepts diverted connections and records the intended destination in the PCAP. For many samples, that is enough to expose the first useful request.
The RondoDox-labeled x86-64 hash f19b0fd9…6a2fd ran natively with the
synthetic invocation /rondo research.x86_64. In each retained passive run it
requested:
GET /softirq.x86_64 HTTP/1.1
from 45.153.34[.]153:80, using User-Agent: rondo. It also emitted the
registration line rondo research.x86_64 1 6 2 r:0 and attempted two TCP/8443
addresses. That is already a useful behavioral profile: architecture-specific
payload request, a named registration format and candidate infrastructure. I
had no reason to add eBPF.
Default FakeNet also captured the ARM sample’s IRC registration. Its generic reply contained no IRC state, so the sample kept registering. Even so, the baseline identified the protocol and the candidate endpoints before I changed the service.
Level 3: speak the protocol the sample expects
A listener can accept a connection and still send the wrong protocol state. At this level I start with a request seen in the baseline, then return one fixed, bounded reply for that protocol. I label every action that follows as conditioned on the reply.
The MIPS hash 9d12a0b1…6d50 sent a DNS TXT question for
manzzkontolaktolakan[.]my[.]id to 8.8.8.8:53 over TCP. It delivered the
two-byte DNS length and the 44-byte question separately. The generic listener
treated the stream as HTTP and never assembled the two-part DNS frame.
I added bounded DNS-over-TCP framing and returned the fixed TXT marker
omoikane-benign-synthetic-txt-v1. After that generated reply, the sample
attempted 104.148.152[.]47:8001 in each corrected run. One run emitted an
eight-byte header followed by 104 opaque bytes. I treat the endpoint as a
conditional lead because a genuine TXT answer remained unavailable. Public
Aisuru reporting makes the DNS-TXT behavior relevant, while the exact hash’s
family label remains provisional.
For the ARM sample, a separate sidecar waited for both NICK and USER, then
returned fixed IRC 001 and 422 lines. On each handled connection, the
sample replied with an original JOIN followed by two more original lines. The
capture classified those lines as OTHER; their command text was never stored,
so I cannot name them.
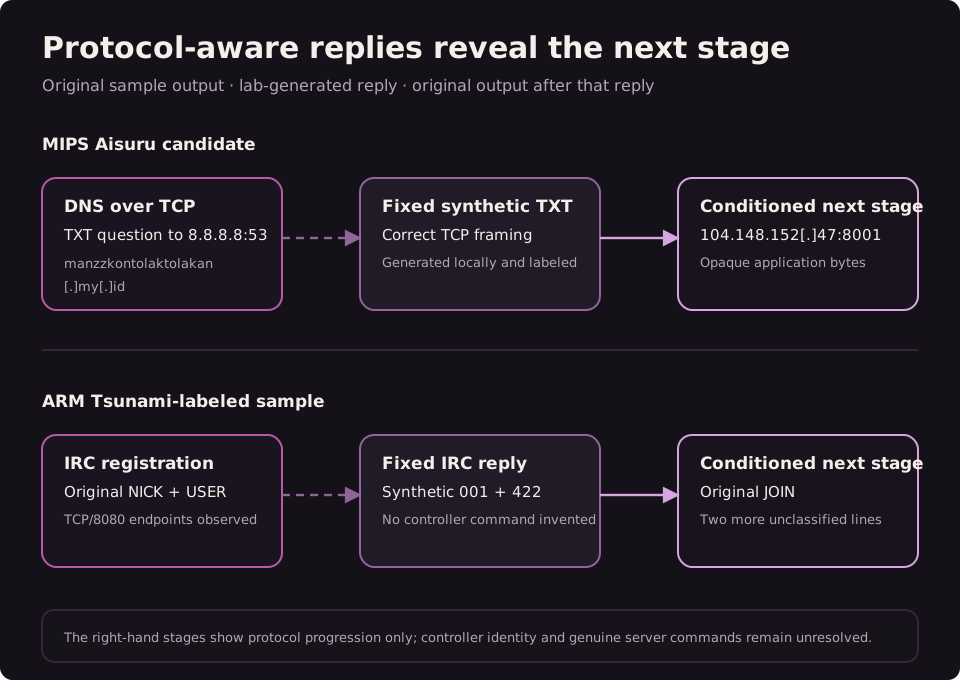
Figure 4. The middle nodes are generated lab input. The right-hand nodes are original sample behavior that appeared afterward and remain conditional.
Neither reply reconstructed a real controller. They answered a narrower question: what does the sample send after a syntactically valid, fixed response? In both cases, better network state exposed more original behavior without changing a value inside the process.
Level 4: change one proven decision input
The i386 RustDuck-reported loader hash b519ae08…d9b was the only sample that
needed Level 4. QEMU and network simulation had already done their job; the
remaining stop was inside the local process tree.
On every baseline run, a child called PTRACE_TRACEME. The container policy
returned EPERM, the child exited with code one, and the kernel encoded that
exit as wait status 256. The parent read 256 and ended the process tree. No
original application bytes reached the network.
The target was the parent’s observation
Faking success for PTRACE_TRACEME would also fake tracer state that the kernel
never created. The trace showed a better target: the parent made its terminal
decision after reading the child’s wait status. I changed that observation
instead of the ptrace result.
The ptrace denial, child exit, kernel wait result and positive wait4 return all
stayed unchanged. The eBPF program could write only when it saw the measured
cgroup, the matched child and parent lifetimes, a successful i386 wait4 for
the explicit child PID with options zero, a valid status pointer, and matching
kernel and user-space values of 256. It wrote four zero bytes to the parent’s
status buffer, then read the value back.
Before calling the write helper, the program marked its single attempt as used. A successful write, a helper failure or a failed readback all closed the intervention for that run, so the hook could never drift to another child. The event record kept the kernel value, the user value before and after the write, and the helper return code.
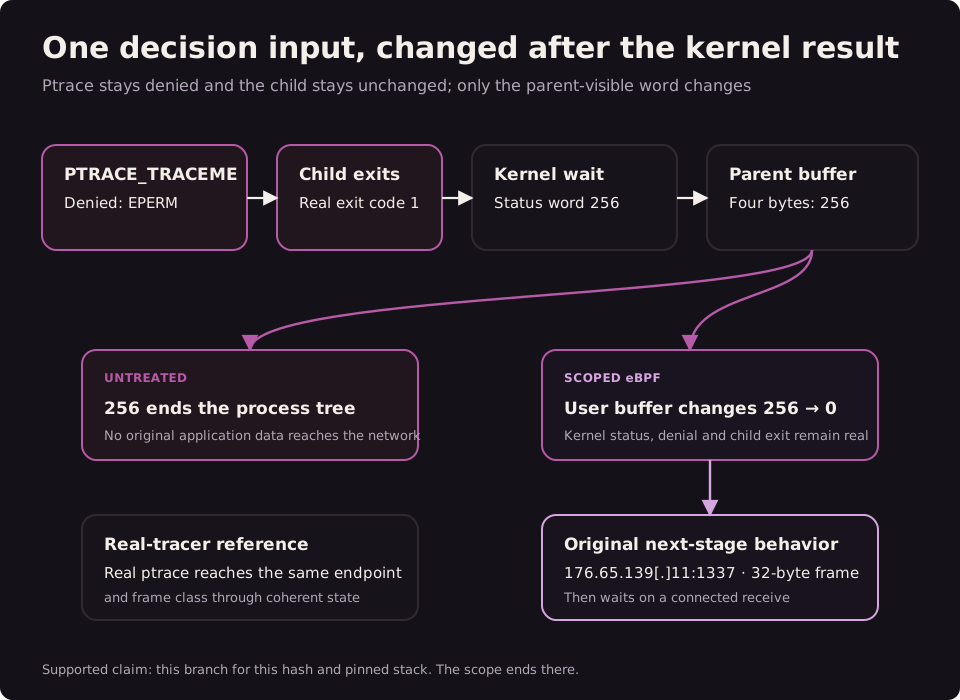
Figure 5. The kernel history remains visible on both paths. eBPF changes only the four bytes the parent inspects; a real-tracer reference reaches the same first network stage through genuine ptrace state.
The controls isolate the change
I ran three one-second repetitions for each condition under the same policy.
None of the three passive baseline runs emitted application payload. All three
eBPF treatment runs exposed 176.65.139[.]11:1337 and one opaque 32-byte frame.
None of the three runs with an active but irrelevant uname hook emitted
payload. Actual ptrace still returned -1 in every one of those nine runs.
I also ran a control that genuinely allowed PTRACE_TRACEME. All three control
runs reached the same immediate endpoint and 32-byte frame, with the child and
wait state following the real traced path. One eBPF-treated run matched all
three controls across the normalized one-second syscall sequence. The other two
treated runs shared the same shorter loop shape.
The controls point to the status word as the branch condition for the first network stage. They do not show that the eBPF treatment reproduced real tracer state.
The second cycle told me to stop
I then extended the treatment window to five seconds. In all three runs, the sample connected and sent a 32-byte frame twice: once near startup and again about four seconds later. After the second frame it waited on a receive from the connected socket while a local polling loop continued. No inbound application bytes arrived, and no second local decision gate appeared.
I stopped tuning eBPF for this sample at that point. The next missing input was on the network, and another memory write would make the cause of any later behavior harder to defend.
What each level revealed
Each level answered one question left by the previous run.
| Level | Question | Example | Observed result |
|---|---|---|---|
| Explicit QEMU | Can the foreign binary execute with guest and host behavior separated? | ARM Tsunami-labeled hash | IRC registration intent and candidate endpoints from an ARM ELF on an x86-64 host |
| Default FakeNet | What does the sample request before a protocol-specific reply? | RondoDox-labeled hash | Downloader path, user agent, registration format and candidate infrastructure |
| Protocol-aware FakeNet | What original action follows a valid, labeled server response? | MIPS Aisuru candidate and ARM IRC hash | Conditional endpoint and first message; IRC JOIN and later command classes |
| Scoped eBPF | Does one observed process value control a terminal branch? | RustDuck-reported loader variant 3 | A candidate endpoint, 32-byte frame and later receive frontier hidden behind the wait-status decision |
By the end, “the sample did nothing” had split into four concrete problems: wrong architecture, a generic service, missing protocol state and one parent-visible branch condition. Each problem needed a different change.
What the eBPF layer adds
eBPF gave me a host-side intervention point tied to the exact execution cgroup. I could keep the real kernel result in the record, change one user-memory output seen by the parent, and retain the before and after values next to the network events that followed. The sample process carried no injected library or debugger.
The helper itself is not new. Linux documents bpf_probe_write_user() as an
experimental tracing helper that can overwrite memory in the current task.
Purifire uses eBPF runtime memory patches
to bypass anti-analysis checks in packed Android apps. It was the closest
published precedent I found.
Purifire targets Android packers and applies defined evasion rules. My test used a native Linux executable and one question: did the wait status seen by the parent control this branch? I compared passive runs, an irrelevant active hook and genuine ptrace state. The write had a readback and a one-attempt budget. I stopped when the sample reached a network wait. I am not making a first-of-kind claim.
Writing user memory is easy to misuse. If a failed connect() result is changed
to zero, the file descriptor may still be unconnected and the next socket call
will expose the mismatch. If nanosleep() returns early while claiming success,
elapsed time will disagree with the return value. In the wait-status case, the
inconsistency stays visible: the kernel record remains 256 while the four bytes
read by the parent change to zero.
I only use this kind of intervention after seeing the same stopping sequence more than once and identifying one decision input. The hook also needs bounded matching, a benign control and readback of the change. A crash, a generic error, a timeout or a receive waiting for a peer is not enough.
For this hash, the endpoint and original 32-byte frame appeared only after the four-byte change. The other samples were better explained by CPU execution or network fidelity and needed no memory write.
Scope
Every run used a full sample hash, an offline packet path and a fixed analysis profile. The records separate harness readiness traffic, original sample traffic, generated replies and original behavior that followed those replies. I list every hash above and mark which behavior depended on a generated reply. I leave out the malware bytes, restricted raw traces and suppressor source code.
The evidence covers these four hashes on one pinned lab stack. It does not rank sandbox products, estimate held-out efficacy, authenticate a controller, prove full execution or establish production EDR quality. A speed comparison with static analysis would need a separate blinded static-analysis arm. Here, the practical finding is that a CPU mismatch, an incomplete network service and one parent-visible value can all produce the same quiet terminal while hiding very different behavior.
References
-
FortiGuard Labs, RondoDox Unveiled: Breaking Down a New Botnet Threat.
-
Abuse.ch, MalwareBazaar and URLhaus sample records linked in the hash table above.
-
QEMU, User Mode Emulation.
-
Mandiant, FakeNet-NG.
-
Asghari and Zhao, To Unpack or Not to Unpack: Living with Packers to Enable Dynamic Analysis of Android Apps.
-
Linux kernel documentation, BPF Design Q&A.